JTAG Protocol Analyzer (PGY-JTAG-EX-PD) are the Protocol Analyzers with multiple features to capture and debug communication between host and design under test. PGY-JTAG-EX-PD is the leading instrument that enables the design and test engineers to test the respective JTAG designs for its specifications by configuring the PGY-JTAG-EX-PD as Master/Slave, generating JTAG traffic and decoding the JTAG protocol decode packets.
[Datasheet Download]
PGY-JTAG-EX-PD is the leading instrument that enables the design and test engineers to test the JTAG designs for its specifications by configuring PGY-JTAG-EX-PD as master/slave, generating JTAG traffic with error injection capability and decoding of JTAG Protocol packets.
Features
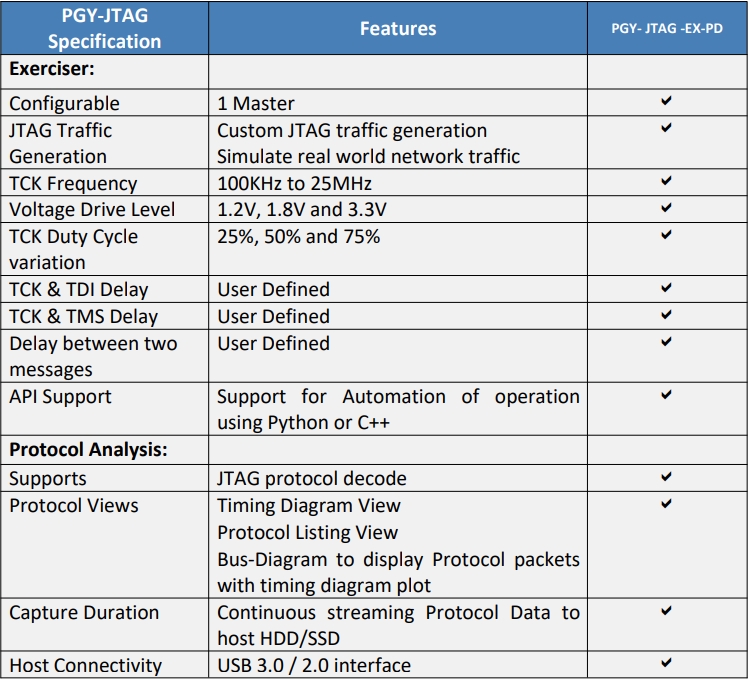
- Supports JTAG frequencies of up to 25MH
- Simultaneously generate JTAG traffic and Protocol decode of the Bus
- JTAG Master Capability
- Variable JTAG data speeds and Duty cycle
- User defined TCK & TDI Delays
- Continuous streaming of protocol data to host computer to provides large buffer
- Timing diagram of Protocol decoded bus
- Listing view of Protocol activity
- Error Analysis in Protocol Decode
- Ability to write exerciser script to combine multiple data frame generation at different data speeds
- USB 2.0/3.0 host computer interface
- API support for automation in Python or C++
Multi Domain View
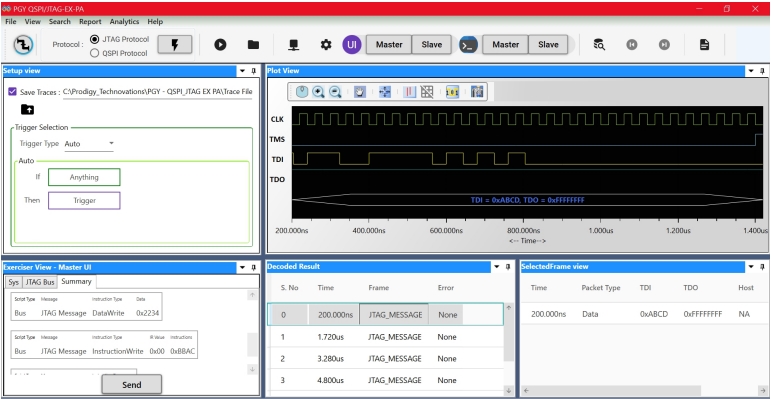
Multidomain View provides the complete view of JTAG Protocol activity in single GUI. User can easily setup the analyzer to generate JTAG traffic using a GUI or script. User can capture JTAG Protocol activity at specific event and decode the transition on JTAG bus. The decoded results can be viewed in timing diagram and Protocol listing window with autocorrelation. This comprehensive view of information makes it industry best, offering an easy to use solution to debug the JTAG protocol activity.
Exerciser
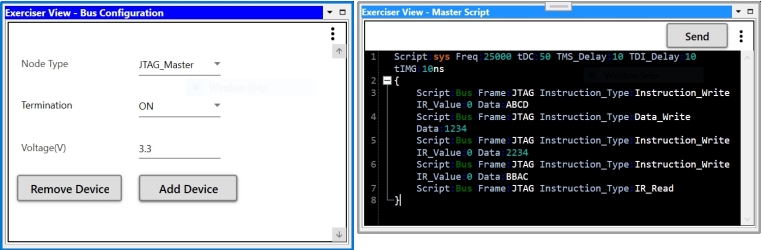
PGY-JTAG-EX-PD supports JTAG traffic generation using GUI and Script. User can generate simple traffic generation using the GUI to test the DUT. Script based GUI provides flexibility to emulate the complete expected traffic in real world including error injections. In this sample script user can generate JTAG traffic as below:
Script Line #1: Set system Frequency 25MHz, Duty cycle to 50%, set TMS_Delay to 10ns, set TDI_Delay to 10 ns, set inter message gap t0 10ns. Script Line #3: Instruction_Write
Script Line #4: Data_Write
Script Line #5: Instruction_Write
Script Line #6: Instruction_Write
Script Line #7: IR_Read
Timing Diagram and Protocol Listing View
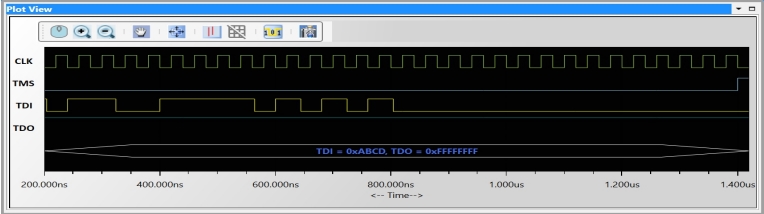
Timing view provides the plot of CLK, TMS, TDI and TDO signals with bus diagram. Overlaying of Protocol bits on the digital timing waveform will help easy debugging of Protocol decoded data. Cursor and Zoom features will make it convenient to analyze Protocol in timing diagram for any timing errors.
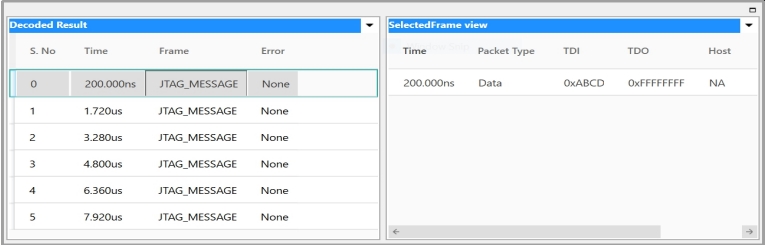
Protocol window provides the decoded packet information in each state and all packet details with error info in packet. Selected frame in Protocol listing window will be auto correlated in timing view to view the timing information ofProtocol window provides the decoded packet information in each state and all packet details with error info in packet. Selected frame in Protocol listing window will be auto correlated in timing view to view the timing information of the packet.
JTAG Specifications